Friday, September 22, 2006
How to Invert Data: Excel Tutorial Using Google Stock Prices
If you're working with data in columns that are sorted in reverse chronological order and you want the reverse or data in general that you want to invert, there's no easy button to push in Excel to do it for you.
Let's say you downloaded the historical stock price of Google and you wanted to chart it (ignore the fact that it's easy to get a chart of Google on Yahoo Finance). Unfortunately, Yahoo Finance gives you the raw data in reverse chronological format so you'd get a chart that was inverted. So you want to invert the series of adjusted closing prices to get a better chart.
1. Open up the .csv file if you downloaded the Google data or whatever spreadsheet you want to invert the data in.
2. Find out how many data points there are in the column of data you want to invert. You can do this by just looking at the row number of the bottom-most data point. The last row of the Google data is 529, but there are only 528 data points since the first is a heading.
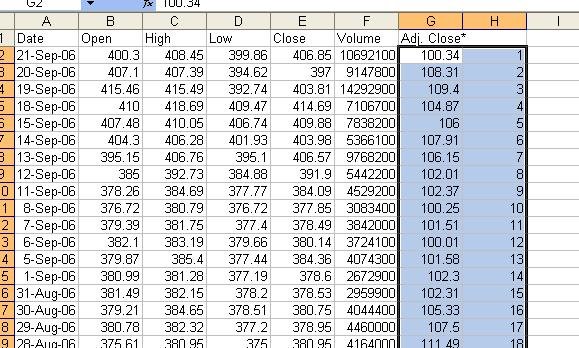
3. Next to the first data point in the column of interest put the number 528. Below it put 527. This gives Excel a pattern to generate a decreasing list of numbers.

4. Highlight 528 and 527 and drag your cursor down to row 529. The last number you get should be 1.
5. You're ready to invert now. Highlight the two columns (the one you're interested in and the one you just created filled with decreasing numbers). Use Ctrl-Shift-Down after you highlight the first two numbers in the two columns to highlight all the data quickly.
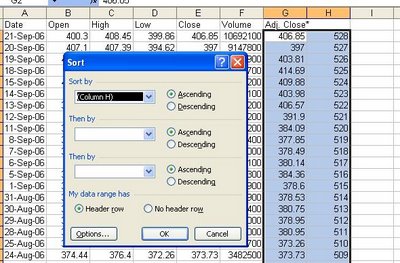
6. Go to Data->Sort. If you're following along with the Google data, choose Column H under Sort By. Ascending is already selected so leave that. Click OK.
 7. You're done!
To start charting, just click the Chart Wizard.
Let's say you downloaded the historical stock price of Google and you wanted to chart it (ignore the fact that it's easy to get a chart of Google on Yahoo Finance). Unfortunately, Yahoo Finance gives you the raw data in reverse chronological format so you'd get a chart that was inverted. So you want to invert the series of adjusted closing prices to get a better chart.
1. Open up the .csv file if you downloaded the Google data or whatever spreadsheet you want to invert the data in.
2. Find out how many data points there are in the column of data you want to invert. You can do this by just looking at the row number of the bottom-most data point. The last row of the Google data is 529, but there are only 528 data points since the first is a heading.
3. Next to the first data point in the column of interest put the number 528. Below it put 527. This gives Excel a pattern to generate a decreasing list of numbers.

4. Highlight 528 and 527 and drag your cursor down to row 529. The last number you get should be 1.
5. You're ready to invert now. Highlight the two columns (the one you're interested in and the one you just created filled with decreasing numbers). Use Ctrl-Shift-Down after you highlight the first two numbers in the two columns to highlight all the data quickly.
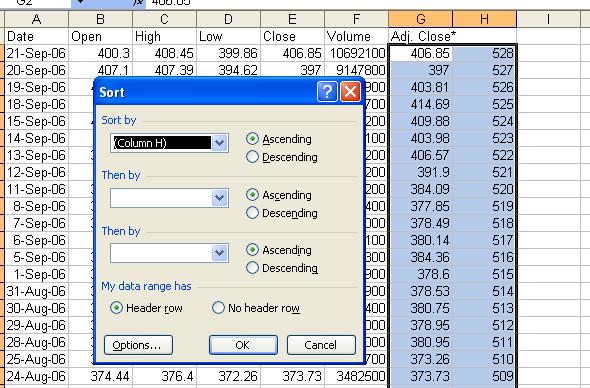
6. Go to Data->Sort. If you're following along with the Google data, choose Column H under Sort By. Ascending is already selected so leave that. Click OK.
 7. You're done!
To start charting, just click the Chart Wizard.
Technorati Tags:
Labels: Technology


